Are you buying a home in the Triangle Area of NC? This North Carolina Triangle area real estate market report 2019 can give you a clear insight to help you make a wise decision. Please check the compiled details below.
The North Carolina Triangle area often referred to as The Triangle is actually a research triangle located in the region of Piedmont of North Carolina united by three key research universities. These are North Carolina State University, Duke University, and the University of North Carolina at Chapel Hill.
The Triangle also cut across the cities of Raleigh, Durham and the town of Chapel Hill. The Triangle area is currently rated as the second largest combined statistical area (CSA) in the entire state of North Carolina.
The entire Triangle area has a population of over two million people which makes it an attractive real estate market.
The Triangle Area Real Estate Market Report
Since the
Triangle area of North Carolina cut across three cities, Raleigh, Durham and the town of Chapel Hill, this report will review the real estate market in all three cities. However, each city will be reviewed separately.
1. Raleigh, NC
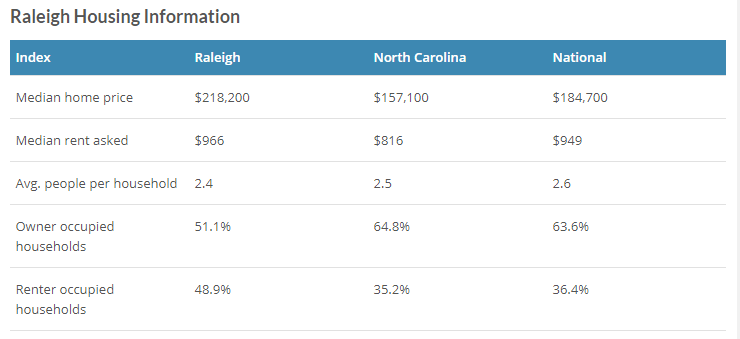
The average cost of homes in Raleigh is $218,200 – an amount that is 39% above the average cost of homes in the state of North Carolina. This clearly indicates that properties are 39% more expensive in Raleigh compared to other areas in the state of North Carolina.
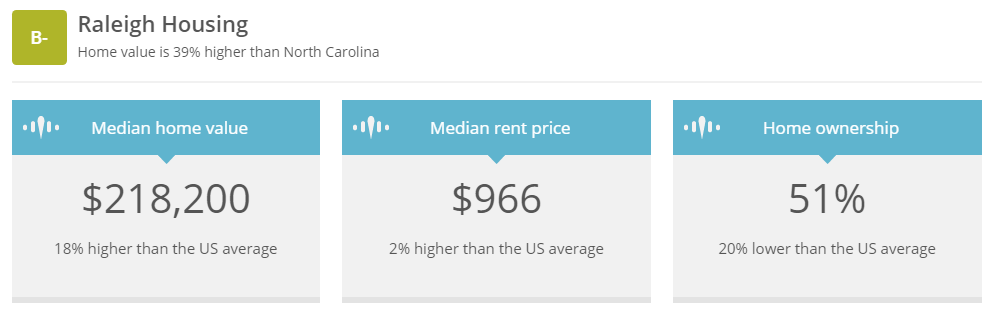
If you’re interested in renting a home in Raleigh, be ready to pay $966 on the average – an amount that is 18% higher than the average rental costs in the state of North Carolina. Up to 51.1% of people who live in Raleigh are homeowners and each home has up to 2.4 occupants on the average.
The good news is you can find all sorts of homes for sale in Raleigh – from townhouses to condos, multifamily units and even tiny houses etc.
How to Calculate Home Affordability in Raleigh
While you’re house hunting in Raleigh or just before you start, it is important to calculate the home affordability in Raleigh, North Carolina. One of the most effective methods of doing so is using the ratio of home price to median household income.
The median home price in Raleigh is $218,200 while the value of the average household income is $58,641. As such, the home price to income ratio is 3.7x – this means home affordability in Raleigh is 14% higher than the state of North Carolina average.
To get the home affordability ratio, you’ll have to divide the average home price by the median home income.
2. Chapel Hill, NC
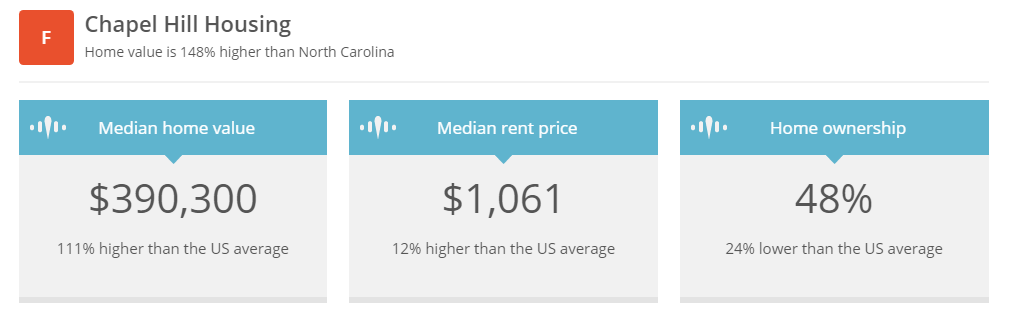
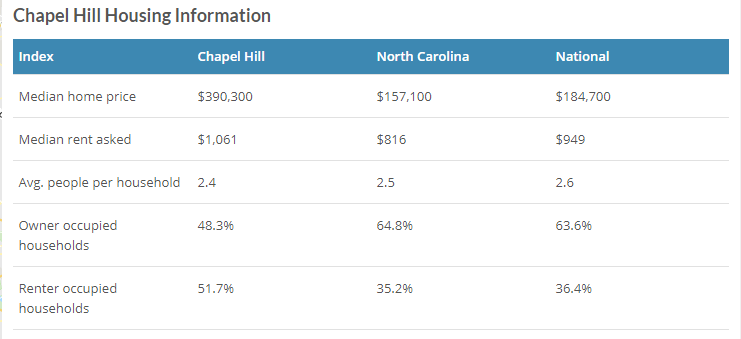
In Chapel Hill, the median home price for homes is $390,300, an amount that is 148% higher than the state of North Carolina average. The median home price in Chapel Hill indicates that buying a home in the area is generally more expensive than the rest of North Carolina.
The city has several different types of homes for sale. From urban townhouses, to affordable condos, luxury homes, and a whole lot more.
If you’re interested in renting a home in Chapel Hill, the median rent price is $1,061, an amount that is 30% higher than the state of North Carolina average. Up to 48.3% of people in Chapel Hill are homeowners with an average of 2.4 people occupying each home.
How to Calculate Home Affordability in Chapel Hill
You can calculate home affordability in Chapel Hill using the home price to median household income ratio. The median household income in Chapel Hill is $65,373 while the city’s median home price is $390,300.
As such, Chapel Hill’s home price to income ratio is 6.0x. This means that Chapel Hill’s home price to median household income ratio is 83% higher than the state of North Carolina average.
To accurately get a home affordability ratio, you’ll have to divide the median home price by the median home income. A higher than average home price to income ratio indicates that homes in Chapel Hill, NC are less affordable as a result of the median price of homes when compared to home income.
3. Durham, NC
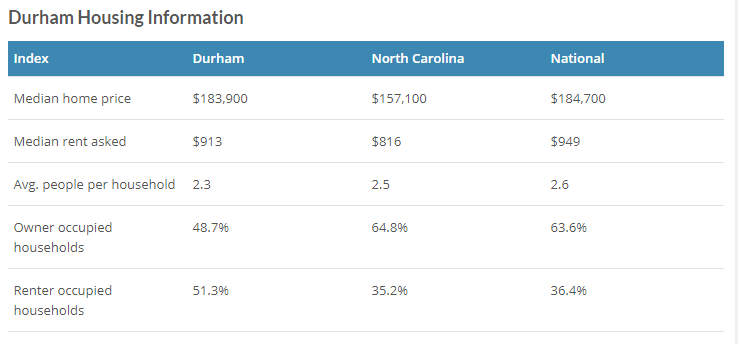
The median cost of homes in Durham, NC is $183,900 and it is 17% higher than the average cost of homes in the state of North Carolina. This means homes in Durham are 17% more expensive than homes in other areas of North Carolina.
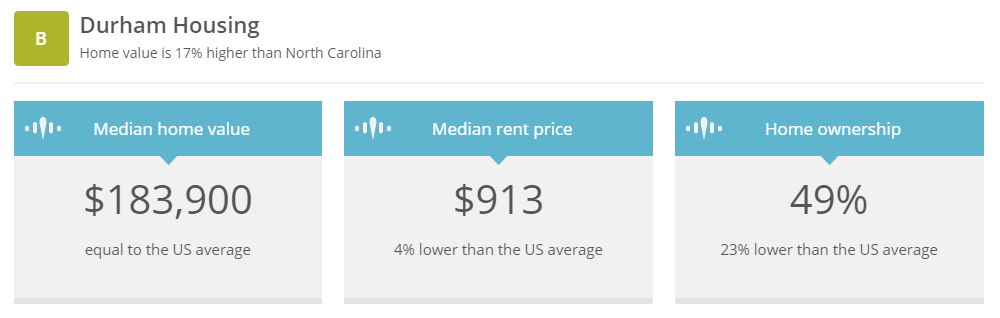
f you’re interested in renting, the median rent price in Durham is $913. An amount that is 12% higher than the average rent price in the state of North Carolina. Among the people who call Durham home, 48.7% of them are homeowners with an average of 2.3 people living in each home on the average.
Whether you’re interested in low-maintenance townhouses or condos, affordable mansions or luxury homes, Durham has a lot of convenient housing options.
How to Calculate Home Affordability in Durham
Home affordability is one of the most crucial factors to consider when you’re house hunting in Durham. The previous formula of the median home price to median household income is absolutely relevant and applicable here.
As mentioned earlier, the medium home price is $183,900 while the median household income is $52,115. As such, the home price to income ratio in Durham is 3.5x – an amount that is 8% higher that the state of North Carolina average cost of homes.
This means you’ll have to pay eight percent more to buy a home in Durham compared to other parts of North Carolina’s average cost of homes.
Whether you’re interested in buying or renting a home in the Triangle Area of NC, this simple market report will give you a clear insight of what to expect and help you make the right decision for a happy ending.
North Carolina Triangle Area Real Estate Market Report 2019 Related Information
Triangle, NC Neighborhoods
Homes for Sale in Lake Hogan Farms, Chapel Hill, NC
Cost of Living in the North Carolina Triangle Area
Homes for Sale in Durham, NC 27517
Homes for Sale in Winmore, Chapel Hill, NC
Homes for Sale in Durham, NC 27703
Homes for Sale in Durham, NC 27704
Homes for Sale in Durham, NC 27560
Homes for Sale in Durham, NC 27701
Homes for Sale in Durham, NC 27503